

Key Takeaways
- Coverage maps show estimated, modeled signal - not guaranteed real-world performance.
- Building materials, terrain, and dense foliage can dramatically reduce indoor and localized signal.
- Different map layers (voice, 4G LTE, 5G) can paint very different pictures of the same area.
- Free trial periods and return windows let you test actual coverage before committing to a plan.
- Crowdsourced signal data from third-party tools can supplement what carrier maps show.
Carrier Coverage Map
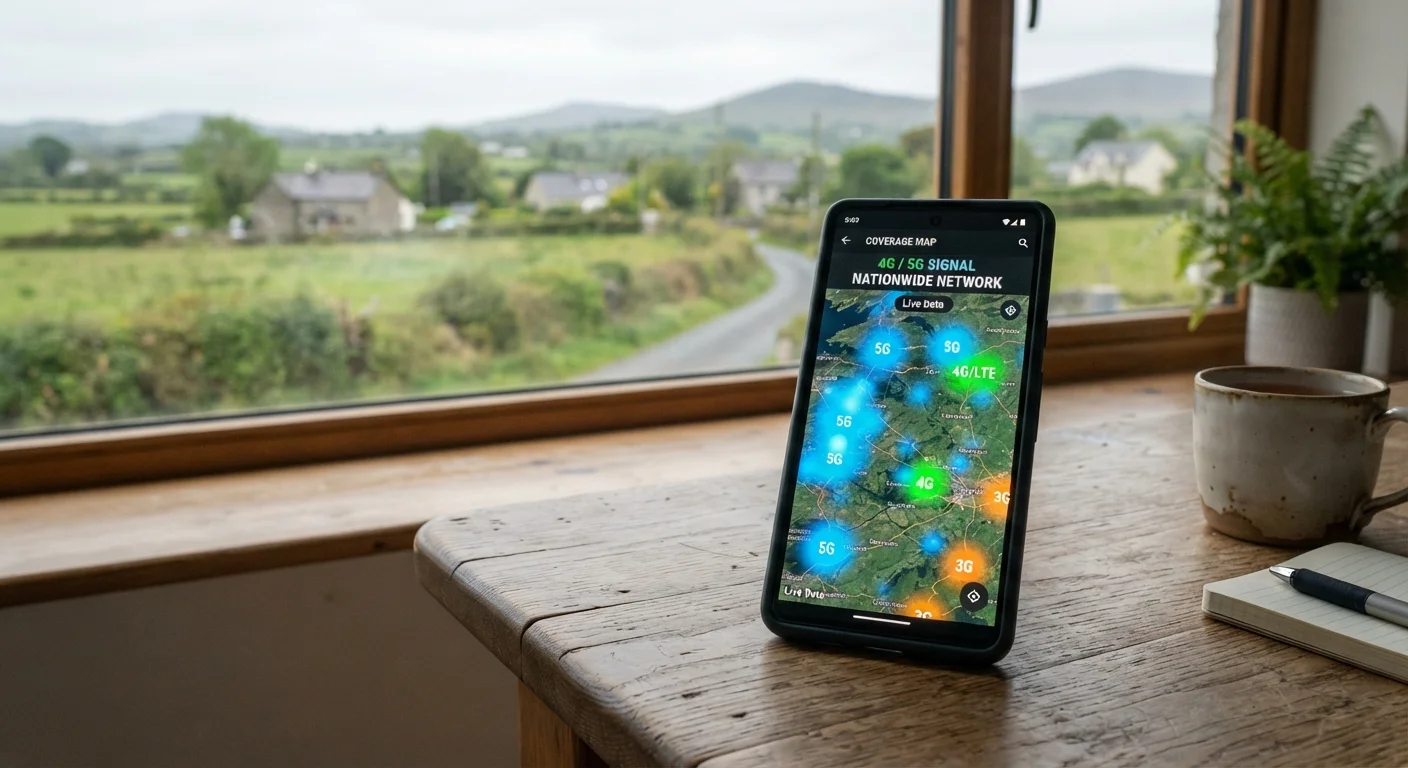
A carrier coverage map is a graphic - usually interactive and available on a carrier's website - that shows where its wireless network is supposed to provide signal. Areas shaded in color are labeled as covered, while unshaded areas indicate little or no service. These maps are used by carriers as marketing and planning tools, but they represent estimated coverage based on network models, not confirmed real-world performance.
Coverage predictions are generated by radio-frequency propagation models that factor in tower locations, antenna angles, and terrain - but rarely account for building materials, foliage density, or local interference.
What Coverage Maps Actually Show
When you visit a carrier's website to evaluate a plan, the coverage map is often the first thing you see. Brightly shaded regions suggest strong, reliable signal across enormous swaths of the country. What those colors actually represent, though, is a modeled estimate - not a measurement.
Carriers generate these maps using software that predicts how radio signals should travel from cell towers, accounting for factors like tower height, antenna direction, and broad terrain features. The output is an approximation. It doesn't account for the specific construction of your home, the metal roof on your office, or the ridge line between you and the nearest tower.
Most carrier maps also offer multiple layers - separate views for voice calls, 4G LTE data, and various 5G bands. A map shaded in one color for "5G coverage" can mask the fact that the fast, high-capacity 5G (typically mid-band or mmWave spectrum) covers only a fraction of the area shown. Nationwide 5G coverage often means low-band 5G, which operates at speeds not dramatically different from 4G LTE in many conditions.
Not All "5G" Coverage Is the Same
Carriers use the term "5G" to describe multiple distinct network technologies operating on different frequency bands. Low-band 5G offers wide geographic reach but speeds that often overlap with mature 4G LTE. Mid-band 5G delivers meaningfully faster speeds but covers a narrower footprint. When evaluating a coverage map, look for whether the carrier distinguishes between these layers - many do, if you look past the default view.
The Gap Between the Map and Reality
Signal behaves differently depending on what it has to travel through. Concrete, brick, metal, and Low-E window coatings are all known to attenuate - or weaken - wireless signals significantly. A house in a "covered" zone on a map may still experience poor or unusable indoor reception simply because of its construction materials.
Geography compounds this further. Valleys, dense forests, and urban canyons created by tall buildings all create shadowing effects that models may not capture at a granular level. Rural consumers are particularly affected: coverage boundaries on maps often follow major roads while omitting the gaps just a mile or two off the highway.
The practical consequence is that two people living within the same colored region on a coverage map can have entirely different experiences. One may have reliable four-bar LTE indoors; the other may struggle to complete a call.
“A coverage map is a model of the world, not the world itself. The gap between the two is where consumer frustration lives.”
— telecommunications policy researcher, Academic expert in wireless network policy and consumer access
How to Test Coverage Before You Commit
The most reliable way to evaluate a carrier's real-world performance in your area is to test it yourself - in the locations that matter most to you. Many carriers allow new customers a trial period, often ranging from 15 to 30 days, during which you can return the SIM or device if service doesn't meet your needs. Use that window deliberately.
- Test where you live and work first. Indoor signal at home and at the office is where dropped calls and slow data hurt most.
- Test your commute and regular routes. If you travel between areas with spotty coverage, note where signal drops on the highway or train route.
- Check less-traveled locations. If you spend time outdoors or in rural areas - including national parks, which often have limited infrastructure - test signal proactively. See our guide to underrated U.S. national parks for a sense of how remote some popular destinations actually are.
If you're already on a plan and experiencing persistent indoor signal problems, there are practical steps worth exploring. Our article on what to do when your carrier's signal fails at home covers options from Wi-Fi calling to signal boosters.
Using Third-Party Data to Fill the Gaps
Several independent tools aggregate crowdsourced signal measurements from actual device users - giving you a ground-level view that carrier maps can't provide. These platforms compile reports from users who have measured signal strength, data speeds, and call quality at specific locations, and they tend to reflect real-world conditions more honestly than propagation models.
The limitation is coverage density: in areas where few users have submitted data, the picture may be incomplete. Urban areas generally have rich crowdsourced datasets; remote rural areas may have thin or no coverage in these tools.
Reading coverage critically - combining carrier maps, third-party data, and your own trial testing - gives you a much more complete picture than any single source. For a comprehensive look at how wireless service works end-to-end, see The Full Picture on Wireless, which walks through network infrastructure, costs, and contract terms together.
~20%
of U.S. geography with limited mobile coverage
FCC mapping data has historically shown significant rural coverage gaps, with ongoing audits revealing that carrier-submitted maps overstated coverage in some areas.
15-30 days
typical carrier trial or return window
Most major U.S. carriers offer some form of satisfaction trial or return policy for new customers, though terms vary by carrier and plan type.
Up to 30 dB
signal loss through building materials
Research on indoor radio propagation shows that common building materials - including concrete walls and low-emissivity glass - can attenuate cellular signals substantially.