

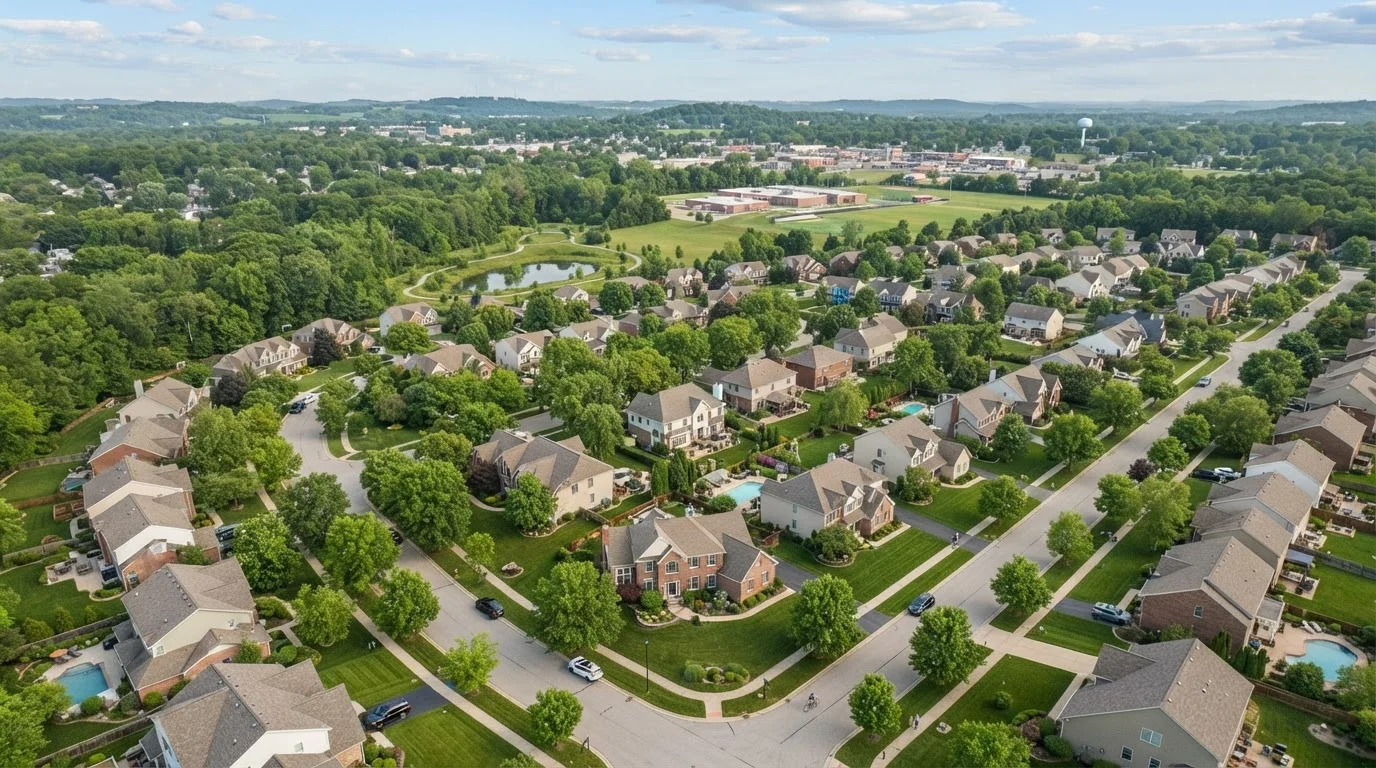
Key Takeaways
- Housing affordability measures the gap between home prices, mortgage rates, and household incomes.
- Three main forces drive affordability: home prices, interest rates, and local wage levels.
- A standard affordability guideline suggests housing costs stay at or below 28-30% of gross monthly income.
- Affordability varies significantly from one metro area to another and can shift quickly.
- Understanding affordability helps buyers set realistic expectations before entering the market.
Housing Affordability
Housing affordability is a measure of how accessible homeownership is for a typical household given current home prices, mortgage rates, and local incomes. When affordability is high, more households can comfortably carry a mortgage. When it's low, fewer can - even those with steady employment. It's a snapshot of the relationship between what homes cost and what people actually earn.
The National Association of Realtors publishes a Housing Affordability Index (HAI) that benchmarks whether a median-income family qualifies for a mortgage on a median-priced home, using a score of 100 as the threshold where they exactly qualify.
The Three Levers That Drive Affordability
Housing affordability isn't just about sticker prices. It reflects an interaction between three variables: home prices, mortgage interest rates, and household income. A shift in any one of them can make homeownership more or less reachable - even without the others moving at all.
When home prices rise faster than wages, affordability erodes. When interest rates climb, monthly mortgage payments increase on the same loan balance, pricing out buyers who were previously qualified. Conversely, when incomes grow or rates decline, affordability improves - sometimes meaningfully - even if asking prices hold steady.
This three-way relationship is why housing affordability can feel confusing. Two markets might have the same median home price but dramatically different affordability profiles if local wages differ substantially. To understand the full picture, see our breakdown of how the housing market works.
28%
Max housing cost share of gross income
The 28% threshold is a standard guideline used in mortgage underwriting to assess whether a housing payment is sustainable for a given borrower.
100
NAR Affordability Index baseline score
The National Association of Realtors' Housing Affordability Index uses 100 as the point at which a median-income household exactly qualifies for a median-priced home mortgage.
1%
Rate increase impact on purchasing power
A one-percentage-point rise in mortgage rates can reduce a buyer's purchasing power by roughly 10-11%, according to general mortgage industry estimates.
How Affordability Is Measured
The most common affordability benchmark used by lenders and housing analysts is the 28/36 rule. It holds that a household should spend no more than 28% of its gross monthly income on housing costs (principal, interest, taxes, and insurance) and no more than 36% on total debt obligations. These thresholds aren't laws, but they're standard reference points in mortgage underwriting.
Your debt-to-income ratio is closely related - it's one of the primary figures lenders use to evaluate whether a borrower can sustain a mortgage payment alongside other financial obligations.
The National Association of Realtors' Housing Affordability Index (HAI) offers a broader view: it calculates whether a household earning the national median income can qualify for a mortgage on a median-priced existing home. A score above 100 means the median household earns more than what's needed to qualify; below 100, they fall short.
Affordability Indexes Have Limitations
National or metro-level affordability indexes use median figures - meaning they reflect the midpoint of all households and home prices, not any individual's situation. A household with student loans, variable income, or significant existing debt may find affordability much tighter than the index suggests. These tools are useful for tracking trends, not for determining your personal purchasing power.
Why Affordability Varies by Location
Affordability is deeply local. A household earning $85,000 a year may find homeownership straightforward in some mid-size Midwestern cities but entirely out of reach in high-demand coastal metros - even with identical mortgage rates. Factors driving local variation include:
- Land availability and zoning - constrained supply pushes prices up
- Job market strength - high-demand employment centers attract buyers, bidding prices higher
- Population growth - inbound migration outpacing new construction tightens inventory
- Local tax rates - property taxes affect the all-in monthly cost of ownership
Understanding how housing inventory affects prices helps explain why some markets remain expensive even as national conditions shift. When fewer homes are available relative to buyer demand, sellers hold pricing power, and affordability suffers.
What Declining Affordability Means for Buyers
When affordability falls, the effects aren't abstract. Households that expected to buy may delay, relocate to more affordable markets, or remain renters longer than planned. First-time buyers - who typically lack equity from a previous sale - feel the squeeze most acutely.
For buyers actively planning a purchase, tracking affordability conditions helps set realistic expectations about budget, timeline, and tradeoffs. It's worth learning how to read a local housing market report to assess conditions in your target area before committing.
Understanding affordability also feeds directly into household budgeting. Before shopping for a home, it's worth reviewing basic budgeting principles to understand what monthly payment is genuinely sustainable - not just what a lender might approve.
This article is for general informational and educational purposes only. It does not constitute financial, legal, or mortgage advice. Consult a licensed financial adviser or mortgage professional regarding your individual circumstances.